
This post is about the question the benchmark tool built in my previous article couldn’t answer: is the agent’s output actually useful?
The benchmark tool gave me detailed data on every run: tool call counts, token consumption, costs, truncation. But “the agent called 6 tools” doesn’t mean what it produced was worth reading. An agent that calls 6 tools and writes five paragraphs restating each tool’s output is not more useful than one that calls 2.
Over time, three questions crystallized:
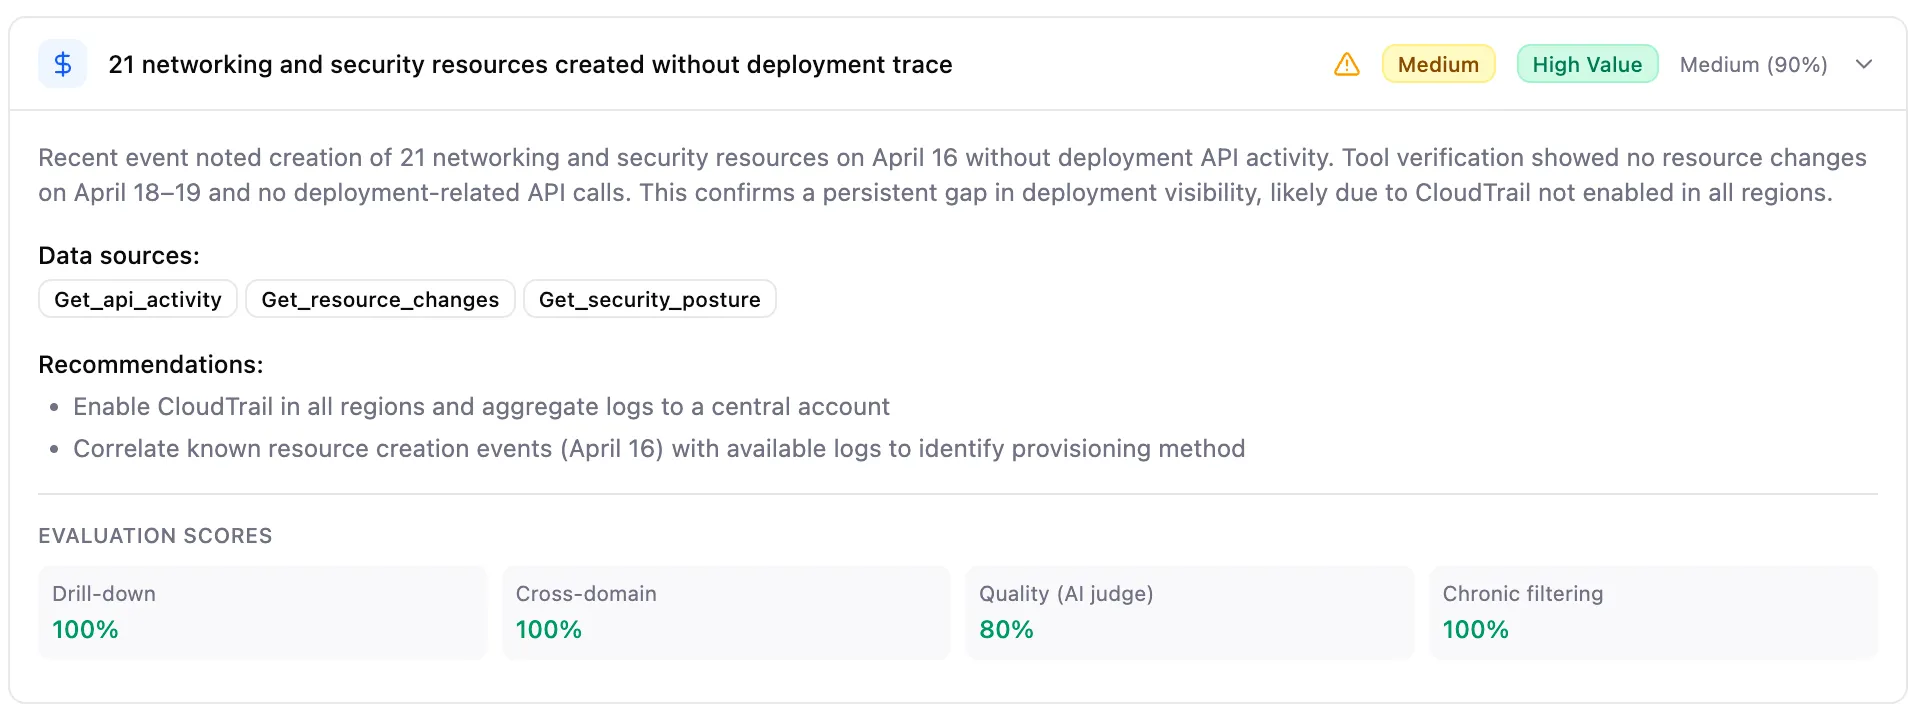
- Non-obvious? Would I see this in 30 seconds on the console?
- Correct? Do the numbers match the tool data?
- Actionable? Would I actually do something after reading this?
Semantic quality vs behavioral quality
Agent quality has two distinct dimensions. Semantic quality is about the content of the output: is the response correct, is it faithful to the tool results, is it clearly written, is it useful. Behavioral quality is about the process behind the output: did the agent call the right tools, did it drill down where it should have, did it correlate data across domains, did it skip known chronic issues.
These two dimensions are measured with different tools. Semantic quality is best measured by an LLM-as-a-judge: a model reads the full trace, the prompt, the tool calls, the tool outputs, and the response, and scores whether the response is correct and useful. A judge model is good at this because the task requires language understanding.
Behavioral quality is best measured by deterministic checks: did the agent call tools from at least two different domains, do the drill-down calls include a filter parameter, are any of the reported findings on the chronic issue list. These are yes/no questions about the structure of the agent’s behavior, and they don’t need a model to answer, they need a function that inspects the trace.
The distinction matters because an agent can score perfectly on semantic quality and completely fail on behavioral quality. “91% of IAM users lack MFA” is correct, faithful to the security findings tool, and useful in the abstract sense of any cloud security recommendation. An LLM judge scores it high. But it’s the first thing on the dashboard, and the agent was built precisely to report things the operator wouldn’t already see. The output is semantically good and behaviorally wrong.
LLM-as-a-judge with Strands Evals
Strands Agents ships with an evaluation framework, strands-agents-evals (version 0.1.2 at the time of my experiments). The first substantial guide is the AWS ML blog post by the Strands team. It organizes evaluation around three primitives: Cases (an input, an expected output, an expected tool trajectory), Experiments (a suite of Cases bundled with Evaluators), and Evaluators, which are LLM-as-a-judge components that score agent output against a rubric.
Two Evaluators are directly relevant here. OutputEvaluator takes a natural-language rubric describing what “good” looks like and asks a judge model to score the agent’s response. TrajectoryEvaluator assesses the sequence of tool calls the agent made; it comes with three helper scorers the judge can use to compare actual against expected trajectories, exact_match_scorer, in_order_match_scorer, and any_order_match_scorer, and crucially these are tools the LLM judge reaches for, not deterministic checks. The whole pipeline is still LLM-driven. Strands Evals also exposes a base Evaluator class you can subclass to write a custom evaluate() that reads OTEL spans from the case’s trajectory directly, which is the one path out of LLM-as-a-judge inside the framework.
I wired a few of these into an evaluator Lambda that ran after every agent execution. A rubric-based OutputEvaluator scored each insight against the non-obvious/correct/actionable criteria. A TrajectoryEvaluator in any-order mode checked that summary tools were called before drill-down tools. A custom subclass did an early version of the cross-domain correlation check by walking span attributes on the trajectory.
The problem that surfaced once everything was running is actually flagged in the Strands Evals docs as expected behavior: LLM-as-a-judge scoring is non-deterministic. The same insight, evaluated twice, came back with different scores. The official recommendation is to run multiple evaluations and aggregate. Directionally this worked (clearly bad insights consistently scored lower than clearly good ones), but the run-to-run variance on any individual insight was larger than the quality differences I was trying to detect between models on sparse data. For regression detection at the aggregate level the scores were usable. For the fine-grained comparison the benchmark tool was designed to do, they weren’t.
On top of that, the rubric-based evaluators were coupled to the agent’s output shape. Every time I tweaked the JSON structure or added a field, the parsing layer in the Lambda needed an update. For a system evolving week to week, that coupling was a real tax.
Testing AgentCore Evaluations
On March 31, 2026, AgentCore Evaluations went GA: a managed evaluation service with 13 built-in evaluators, support for custom evaluators, and two execution modes, online and on-demand. This is where the deliberate test I mentioned at the start begins. I wanted to understand what the managed service covers for a production evaluation workload, what the built-in evaluators actually measure, how custom evaluators behave in practice, and what the boundaries are. I’d already instrumented the agent with OTEL, traces were in CloudWatch. The managed service would read them and score.
The built-in evaluators that seemed most relevant were Correctness and Helpfulness. Both are LLM-as-a-judge: a judge model receives the full trace and scores semantic quality. This is useful as a baseline, if those scores drop after a change, something is semantically broken. But given the distinction between semantic and behavioral quality, I already knew they wouldn’t catch the domain-specific failures that mattered for this agent. The plan was to pair them with custom evaluators running deterministic behavioral checks.
AgentCore Evaluations, in every mode and for every evaluator type, takes OTEL spans as input. The evaluate() API accepts sessionSpans in OpenTelemetry format. Online evaluation points at CloudWatch log groups (primarily aws/spans for structural data and the agent’s log group for conversation content) and samples from there. Whether you’re running Correctness and Helpfulness as built-ins or a custom evaluator, the data the evaluators see is the spans.
The first thing I needed was spans with real content in them. The log group was filling up with hundreds of spans, all infrastructure noise: IMDS calls, urllib3 HTTP activity, boto3 internals from ADOT auto-instrumentation. No agent-level spans, no tool spans, nothing about what the agent was doing. A judge model scoring Correctness or Helpfulness on those would have no prompt, no tool calls, no response to work with.
The reason is that Strands emits its own spans (with scope strands.telemetry.tracer, covering agent invocations and tool calls) only when you pass trace_attributes to the Agent constructor, with session.id as the minimum required attribute. Without that, ADOT still captures low-level HTTP calls, but nothing from Strands itself. The agent runs and produces output, but from an observability standpoint it’s invisible.
The fix was passing trace_attributes in the Agent constructor:
trace_attrs = {"session.id": session_id} if session_id else None
agent = Agent(
    model=self.model,
    system_prompt=INSIGHT_ORCHESTRATOR_SYSTEM_PROMPT,
    tools=tools,
    hooks=[ToolCallLoggingHook(session_id=session_id)],
    trace_attributes=trace_attrs,
)
It’s worth noting that the AgentCore SDK ships BedrockAgentCoreApp with @app.entrypoint, a thin wrapper that turns a decorated function into a single /invocations endpoint and handles /ping automatically. That’s the happy path for one-agent-one-endpoint deployments, and session propagation is probably wired for you there, because the wrapper owns the request handler and can do whatever it wants with the incoming headers and payload.
But my container serves more than one route. The same runtime exposes separate endpoints for different operations in the pipeline (news relevance analysis and insight generation, among others), each with its own agent configuration. For this reason, I’ve built my with FastAPI for its routing and Pydantic validation. The AgentCore Runtime HTTP contract is framework-agnostic and only requires /invocations and /ping on port 8080, so any HTTP server works. But the SDK’s single-entrypoint model doesn’t fit that: the decorator is designed for one function per app.
The tradeoff is that anything the SDK handles implicitly becomes your problem. Session propagation is one of those things: session_id comes in as runtimeSessionId on the API call, but the agent code needs it as a trace attribute on the Strands Agent instance, and with a custom server you wire that propagation yourself.
One side effect of turning on ADOT auto-instrumentation: every library that uses standard Python logging starts shipping its logs through OTEL. Including boto3 and botocore, which at DEBUG level emit the entire contents of every API response. For a DynamoDB query returning a few KB, you get multi-MB log entries. The OTEL log exporter has a batch size limit (1MB), and those entries overflow it. Logs silently drop, and with them your agent’s own structured logs.
The fix is to silence the noisy loggers before ADOT captures them. For this agent that meant fifteen separate loggers:
for _boto_name in (
    "boto3", "boto3.resources", "boto3.resources.action",
    "botocore", "botocore.hooks", "botocore.loaders",
    "botocore.credentials", "botocore.endpoint", "botocore.regions",
    "botocore.client", "botocore.utils", "botocore.configprovider",
    "urllib3", "urllib3.connectionpool",
):
    logging.getLogger(_boto_name).setLevel(logging.WARNING)
Not obvious until you realize your own logs have stopped appearing.
Structured tool logging via Strands hooks
While I was in the instrumentation code anyway, I added a custom hook that emits structured TOOL_CALL and TOOL_RESULT log entries for every tool invocation. Strands exposes BeforeToolCallEvent and AfterToolCallEvent through its hook system, and the hook just listens on both:
class ToolCallLoggingHook(HookProvider):
    def __init__(self, session_id: Optional[str] = None) -> None:
        self.session_id = session_id or "unknown"
        self._call_start_times: dict[str, float] = {}

    def register_hooks(self, registry: HookRegistry) -> None:
        registry.add_callback(BeforeToolCallEvent, self._on_before_tool_call)
        registry.add_callback(AfterToolCallEvent, self._on_after_tool_call)

    def _on_before_tool_call(self, event: BeforeToolCallEvent) -> None:
        tool_use = event.tool_use
        tool_name = tool_use.get("name", "unknown")
        tool_input = tool_use.get("input", {})
        tool_use_id = tool_use.get("toolUseId", "")
        self._call_start_times[tool_use_id] = time.monotonic()
        logger.info(
            "TOOL_CALL: tool=%s session_id=%s input=%s",
            tool_name, self.session_id, truncate_for_log(tool_input),
        )

    def _on_after_tool_call(self, event: AfterToolCallEvent) -> None:
        tool_use = event.tool_use
        tool_name = tool_use.get("name", "unknown")
        tool_use_id = tool_use.get("toolUseId", "")
        start = self._call_start_times.pop(tool_use_id, None)
        duration = time.monotonic() - start if start else 0.0
        output = event.result if event.result is not None else ""
        logger.info(
            "TOOL_RESULT: tool=%s session_id=%s duration=%.3fs output=%s",
            tool_name, self.session_id, duration, truncate_for_log(output),
        )
Inputs and outputs are truncated to 2KB to keep log entries bounded. This gives me two independent observability paths: OTEL spans in CloudWatch for tracing and evaluation, and structured logs with tool-level detail for debugging. When something looks wrong, I can go to either source and reconstruct what happened.
Built-in evaluators in online mode
With the spans finally carrying the agent’s activity, I configured Correctness and Helpfulness in online mode. Under the hood they’re LLM-as-a-judge: a judge model receives the full trace and scores semantic quality. Correctness checks whether the agent faithfully reported tool data. Helpfulness checks whether the response is useful. Both are real and useful as passive regression detectors: if either drops after a change, something broke.
They also confirmed what I already knew from the semantic vs behavioral distinction: they score high on banalities. “91% lack MFA” is correct and helpful. Five well-structured single-tool findings are correct and helpful. The evaluators can’t see that the agent failed its actual job.
Custom evaluators via the evaluate() API
For the behavioral checks I tried the evaluate() API in on-demand mode. Two limitations surfaced.
It doesn’t pass evaluatorName to the Lambda. I’d built all three evaluators as a single Lambda with routing, which is the standard pattern. The API invokes the Lambda without saying which evaluator to run. I had to split into three separate Lambdas.
It rejects OTEL events. OTEL traces have spans (operation records) and events (details like agent output text and tool parameters). The API passes only spans. Without events, cross_domain_correlation couldn’t see the output text, and drill_down_filter_usage couldn’t see tool parameters.
So after a while I stopped using evaluate() and invoked the Lambdas directly from the Step Function, passing them the full trace data (spans plus events) that the managed API was stripping.
AgentCore Evaluations limitations and trade-offs
The built-in evaluators are LLM-as-a-judge and usually measure semantic quality well enough. For an agent whose job is to answer questions, or to generate a response where correctness against the tool outputs is what matters, Correctness and Helpfulness are meaningful metrics. For my agent, where the failure mode is “produces correct but obvious output,” they don’t gate quality. They’re useful as passive regression detectors. Enabling them costs nothing and gives a baseline.
The custom evaluators can be code-based, which is the right choice for deterministic behavioral checks. The evaluate() API has limitations that matter in practice: it doesn’t pass the evaluator name to the Lambda (so you can’t route multiple evaluators through a single function), and it strips OTEL events (so evaluators that need to inspect the agent’s actual output text or tool input parameters don’t get the data they need). These aren’t principled limitations, they’re current shape-of-the-API issues that may evolve, but they’re real today.
In my specific use-case, the managed path adds complexity without adding value. Since the agent already runs in an orchestrated pipeline with structured inputs and outputs between steps, the pipeline itself is a better place for custom evaluation than a separate service that has to reconstruct the data from traces.
Once I was bypassing evaluate(), I kept the custom evaluators as deterministic Lambda code and moved them into the Step Function. The evaluate_insights step receives the agent’s output directly from the previous step and runs the three evaluator checks. No evaluate() API call, no span collection, no log group parsing. The evaluator Lambdas receive the data they need as input.
Correctness and Helpfulness keep running in online mode on the same spans, as regression detectors. OTEL instrumentation remains for operational observability in CloudWatch.
So, custom evaluation ended up running in the Step Function, which a careful look at the architecture would probably have suggested from the start. Was the test still worth doing? Yes.
Built-in evaluators are useful, just not for every use-case. Correctness and Helpfulness do what they say. They measure semantic quality with LLM-as-a-judge. For response-generation agents or assistants where faithfulness and usefulness are the quality bar, they’re a solid default. For agents whose purpose is specific behavior (correlate domains, filter noise, apply domain rules), they need to be paired with custom checks that measure the behavior itself.
The distinction between semantic and behavioral quality matters. An agent can be correct and helpful while failing at its purpose. Knowing which dimension you’re measuring changes what evaluators you reach for.
Managed services for evaluation fit best when the agent’s data is inside the service boundary. AgentCore Evaluations works well when spans are the natural unit and the evaluator’s job is expressible as “look at the agent’s response and judge it.” When the evaluator’s job is structural (did the agent call these specific tools in this specific way, with these parameters, producing an output referencing these specific domains), and when the agent already runs in an orchestrated pipeline that has all this data natively, the pipeline can be a better place.
Testing a new managed service in production is a legitimate part of the work. I picked up AgentCore Evaluations deliberately to map its edges, find the limitations that aren’t in the docs, and build a mental model of where it fits. The final architecture reflects that understanding: built-in evaluators running in online mode as regression detectors, custom behavioral checks running in the Step Function where the data lives.