
After redesigning the tools and encoding a two-pass reasoning process in the prompt, the agent was running within budget. But the output was still underwhelming: restated dashboard summaries instead of cross-domain correlations. The first suspicion was that maybe the model was not smart enough; that was a feeling, though, not a measurement.
To turn it into a measurement I needed to compare models systematically. Not by reading one output and guessing, but by running the same scenario on multiple models, multiple times, and comparing structured data. So I built a benchmarking system.
Building a benchmark tool to compare Bedrock model runs
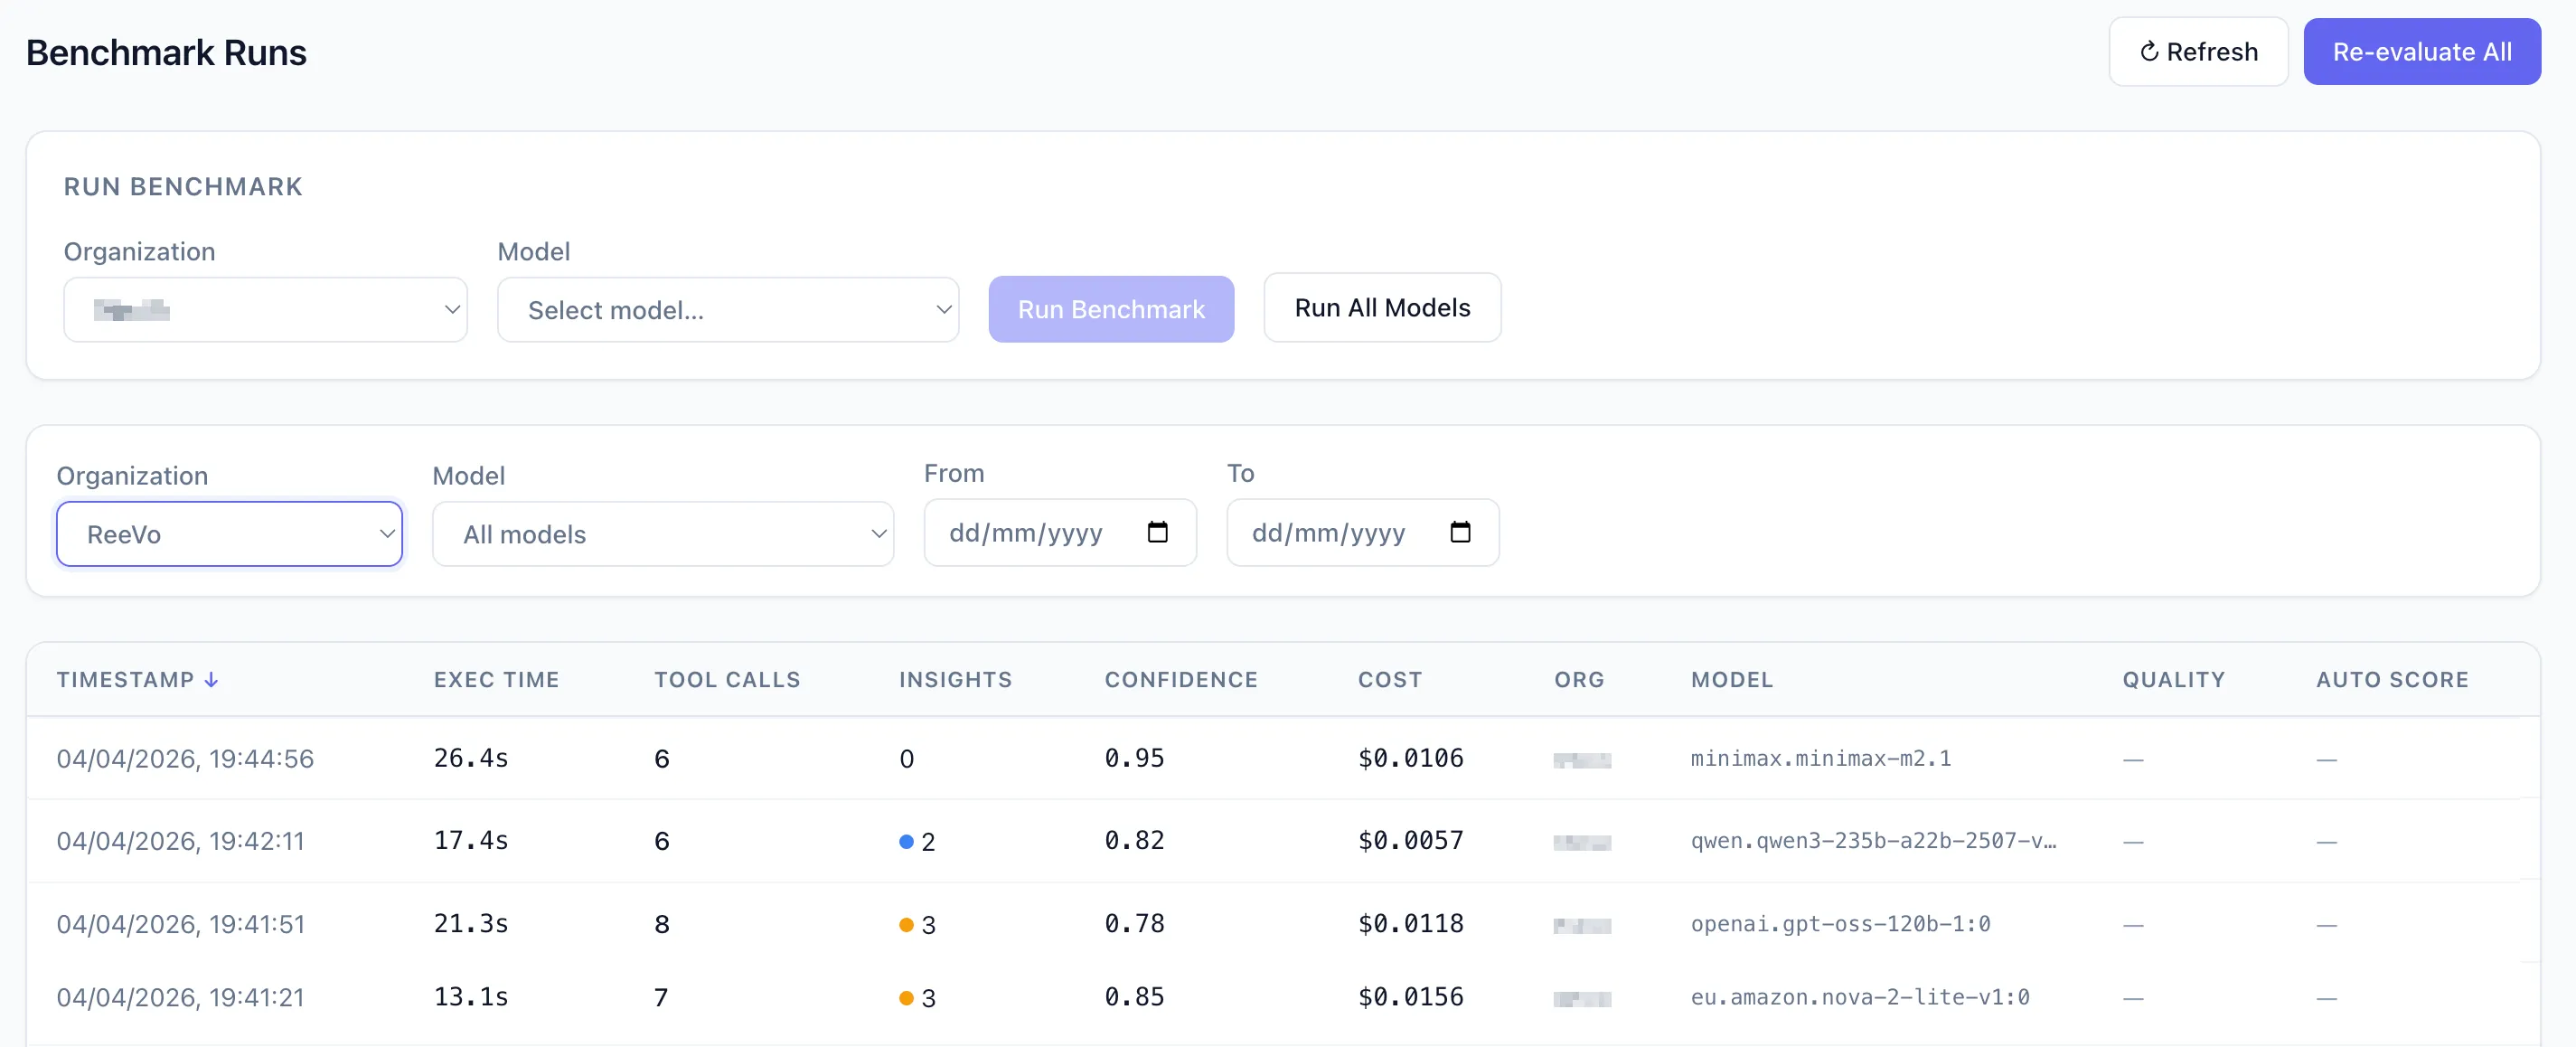
I built a benchmarking app with a DynamoDB table that recorded every agent execution: which Organization was analyzed, which Bedrock model (the full inference profile ID), wall clock time, tool call counts (total, succeeded, failed), specific tools called, input and output token counts, estimated cost in USD from a per-token price lookup, number of insights, insight type, confidence score, a summary of each insight, the Bedrock stop reason, and any limitations the agent reported.
On top of that, an orchestration layer: a worker that could trigger runs across different models. Same tools, same prompt, same date range, different model ID.
And a React webapp with three views: a summary table (one row per run, sortable by any column), a comparison view (group by model, averages side by side), and a detail view (click any run, see the full output with every insight).
With Converse API, switching models became a parameter: same agent code, same tools, same prompt, different model ID.
The prompt describes a six-step reasoning process that needs 6-8 tool calls minimum. Interestingly, Nova was calling get_cost_summary, sometimes get_security_posture, and immediately producing output. No investigation, no drill-down, no correlation. The prompt says “discard anything obvious,” and the model’s output was entirely obvious things because it never investigated far enough to find anything else.
Before the data I had a feeling. After the data I had a number, and the number explained why prompt rewrites hadn’t helped: the model couldn’t execute a multi-step plan.
All models performed dramatically better than Nova: 5-7 tool calls, actually following the two-pass protocol, attempting cross-domain correlation.
But the insights themselves were not meaningfully different across the capable models. Even with many runs per model, the variation within a model was about as large as the variation between models. The signal was buried in noise.
The reason was the data. My test Organization had a handful of accounts, limited services, and steady-state workloads. Nothing non-obvious was happening. Every model produced the same straightforward observations because those were the only observations the data supported.
The benchmark tool was built to answer “is the model the bottleneck?” The answer: partially. Nova genuinely can’t do multi-step reasoning. But beyond a minimum capability threshold, the data matters as much as the model.
AgentCore Runtime session lifecycle and batch workload billing
My agent runs on a scheduled batch workload: a scheduler triggers it a number of times in the early morning, each invocation completes quickly, and then nothing until the next day. Given that AgentCore Runtime is billed by session duration, the expected cost profile was a small number of short jobs, with total compute time amounting to a short window per day and a correspondingly small cost.
The bill told a different story: the daily cost was significantly higher than expected, despite the agent only running for a few minutes each morning. The gap between expectation and reality was large enough that the first assumption was a misconfiguration somewhere, but a closer look at how AgentCore Runtime handles sessions showed that the default behavior was doing exactly what it was designed to do, just not what this workload needed.
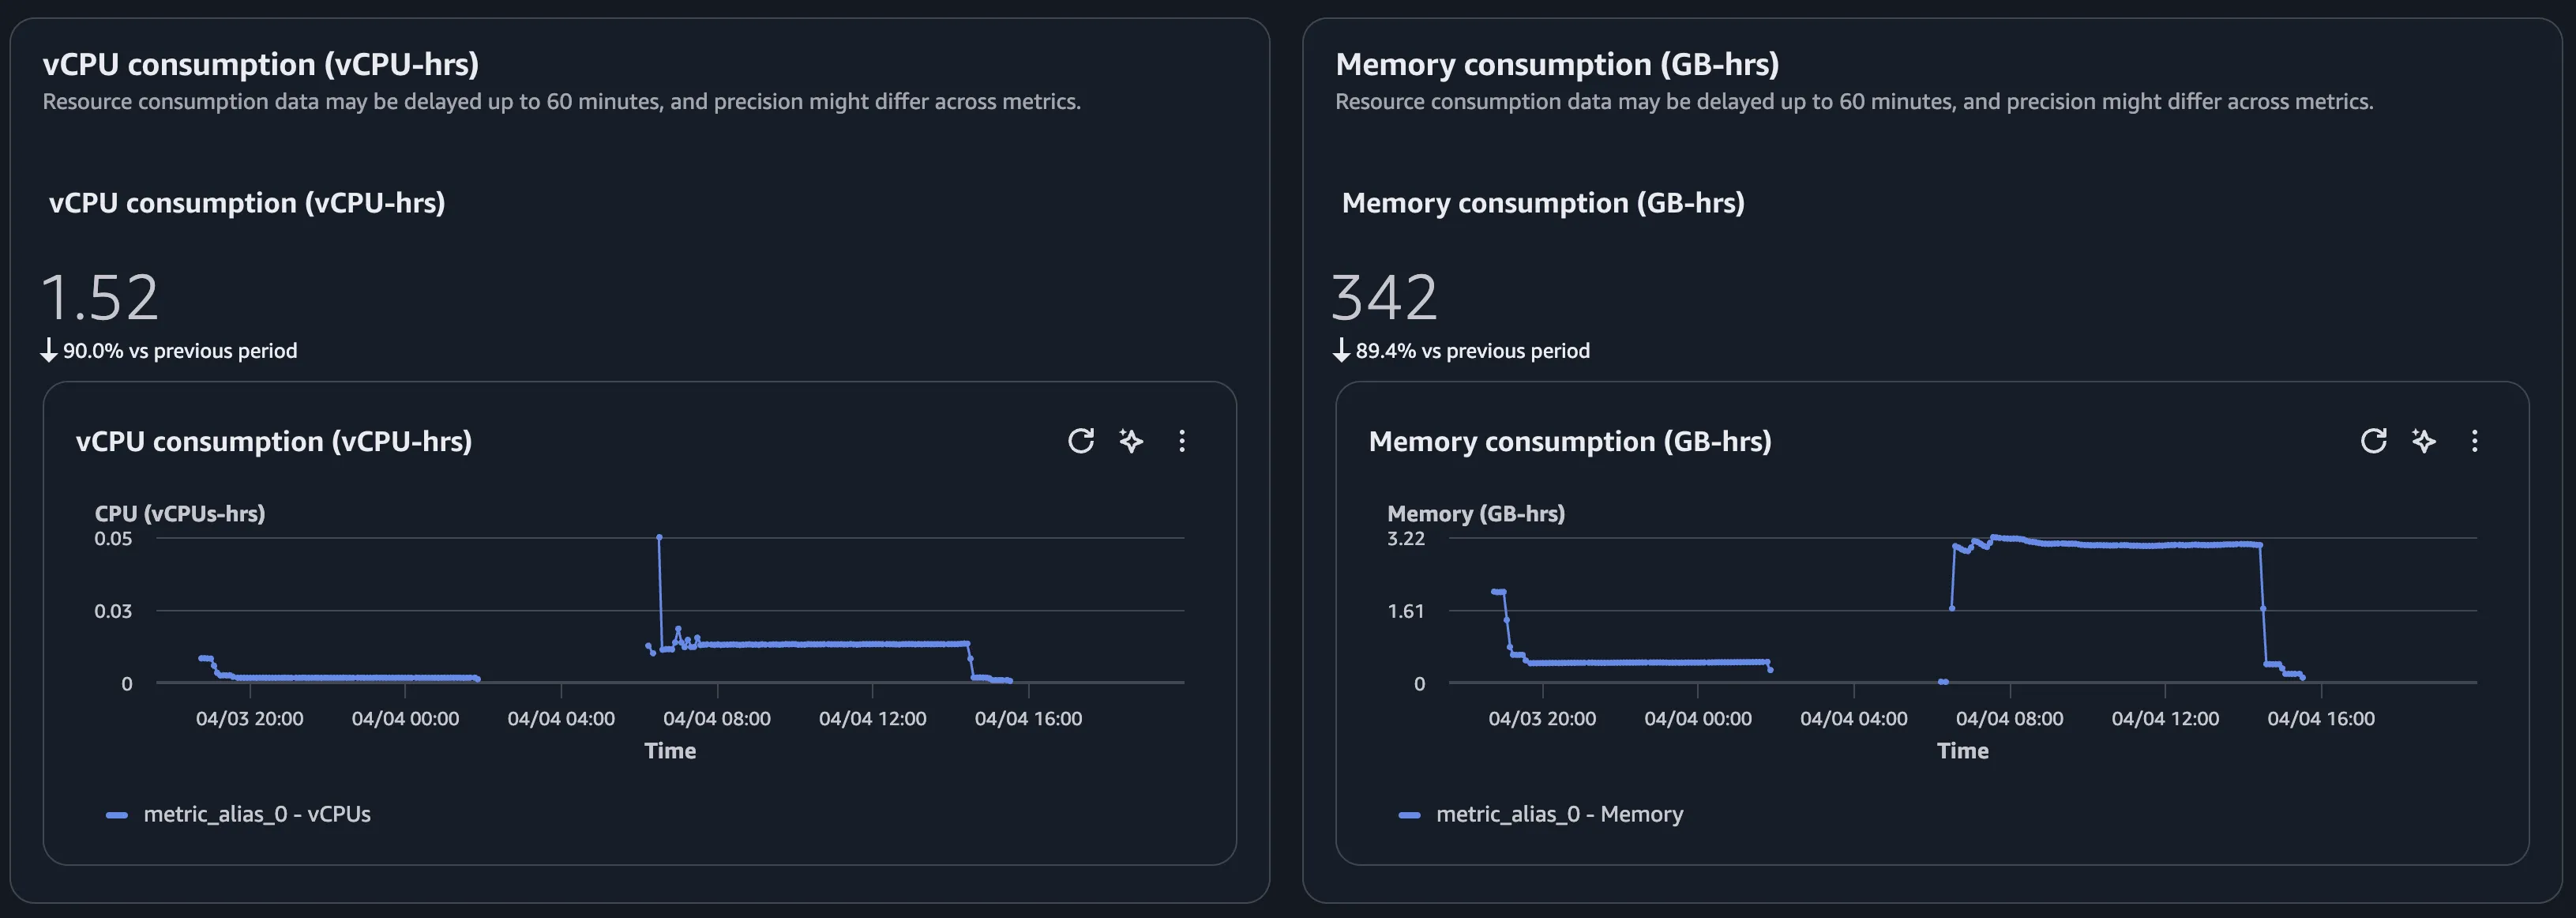
A session in AgentCore Runtime doesn’t end when the agent finishes processing. Each unique session_id provisions a dedicated microVM with 3.22 GB of memory, and that microVM stays alive until the idleRuntimeSessionTimeout expires. The default value is 900 seconds, that is 15 minutes, and billing covers the entire time the microVM is up, not just the time the agent is actively computing.
This makes sense for interactive agents where a user has a conversation, pauses, comes back, continues. The microVM stays warm for the next turn. For that workload, 15 minutes of idle is a reasonable default.
For my workload, it was the opposite of what I wanted. My code was generating a fresh UUID per invocation (f"insight-session-{uuid.uuid4().hex}"), which meant every invocation got its own session, which meant every invocation spawned its own microVM that then sat idle for 15 minutes after a 30-second job. 20 invocation per Organizations, times 15 minutes of idle each = microVMs alive through most of the morning. That’s where the unexpected cost was coming from.
The fix was two things. First, a LifecycleConfiguration with the minimum idle timeout:
lifecycle_configuration=LifecycleConfiguration(
    idle_runtime_session_timeout=60,  # minimum allowed (range: 60-28800)
    max_lifetime=300
)
Second, reusing session_ids per Organization instead of per invocation, so all analyses for the same Organization run sequentially on one microVM rather than spawning forty of them.
Cost dropped by over 90%, back in line with what I’d expected from the start.
The pricing model isn’t wrong, it’s optimized for a different workload shape than mine. Interactive, session-oriented use gets a warm microVM for free follow-up turns. Batch, stateless, fire-and-forget use, unless you configure it explicitly, pays for idle time it doesn’t need. The defaults are reasonable for the documented use case and wrong for mine.
Avoiding duplicate work on repeat invocations
Another behavior of AgentCore Runtime is worth documenting. The same /invocations endpoint can be called more than once by AgentCore on the same container with the same session_id and the same payload. This can happen for several reasons: a client retry, an orchestrator replay, an infrastructure-level timeout.
For an interactive agent where re-running the same request produces a similar response, this is harmless. For a batch agent each invocation has a concrete cost: it reads a lot of data and sends prompts to Bedrock that consume tokens. Running the same analysis twice for the same session means paying twice and producing the same result twice.
The defense is a session cache inside the FastAPI server. The first time a request arrives for a given session_id, the agent runs and the result is stored in an in-memory dictionary keyed on session_id. If a second request arrives with the same session_id, the server returns the cached result without re-running the agent.
_session_cache: Dict[str, Dict[str, Any]] = {}
_session_lock = threading.Lock()

@app.post("/invocations")
async def invocations(request: Request) -> JSONResponse:
    body = await request.json()
    session_id = body.get('session_id')

    # Return cached result if we've already processed this session
    if session_id:
        with _session_lock:
            cached = _session_cache.get(session_id)
        if cached is not None:
            return JSONResponse(
                content=cached["content"],
                status_code=cached["status_code"],
            )

    # ... normal processing ...

    # Cache the result before returning
    if session_id:
        with _session_lock:
            _session_cache[session_id] = {
                "content": result,
                "status_code": status_code,
            }

    return JSONResponse(content=result, status_code=status_code)
Keyed on session_id, cleared when the container shuts down. The containers are short-lived in AgentCore so unbounded growth isn’t a concern. This means repeat invocations for the same session return instantly without re-running the agent.
Paired with the lifecycle configuration and session_id reuse per Organization, this is the defensive posture that made AgentCore behave the way I’d expected it to behave from the start.
Beyond model benchmarks: measuring agent output quality
The benchmark tool answered its primary question and raised a new one. I had solid visibility into what the agent was doing. I could see tool call patterns, costs, truncation, tool bugs. I knew the model mattered up to a threshold, and that beyond that the data mattered more.
What I still couldn’t do was measure, automatically, whether the output was actually useful. The three quality questions (non-obvious? correct? actionable?) were clear in my head from reading hundreds of outputs. Turning them into something automated, and the infrastructure detours I took getting there, is the next post.